Garmin Health Metrics Explained: How To Use Your Data
Tech

Key Findings
Mastering your Garmin health metrics transforms raw biometrics into a personal blueprint for wellness. Tracking data like HRV and Body Battery allows you to balance peak performance with essential recovery. By using these insights to monitor your daily status, you can turn complex physiological data into clear, actionable habits that prevent burnout and optimize health.

Garmin watches can track far more than steps and workouts. They collect detailed health metrics like heart rate, HRV status, sleep, stress, Body Battery, respiration, blood oxygen, recovery time, and training load, giving you a deeper view of how your body is responding to daily life and exercise.
The challenge is knowing what to do with all that information.
In this guide, we’ll break down the most important Garmin health metrics, explain what they mean, and show you how to use your data to make smarter decisions about training, recovery, sleep, and overall well-being.
What Health Metrics Does Garmin Track?
Garmin uses a combination of optical heart rate sensors, accelerometers, and advanced algorithms to paint a holistic picture of your physical state.
By monitoring the tiny variations in the time between your heartbeats and the movement of your body throughout the day, the device creates a baseline of your unique biology.
The ecosystem tracks a wide variety of data points, including:
Cardiovascular Health: Resting heart rate, heart rate variability, and VO2 Max.
Activity Levels: Daily steps, floors climbed, and intensity minutes.
Recovery and Readiness: Body Battery, sleep scores, and recovery time.
Blood and Respiratory Metrics: Pulse Ox (SpO2) and respiration rate.
Stress and Wellness: All-day stress tracking and hydration logging.


How To Interpret Every Garmin Health and Activity Stat
To truly use Garmin metrics to your advantage, you need to look past the daily totals and understand the "why" behind the numbers. Here is a breakdown of the most critical stats your device provides.
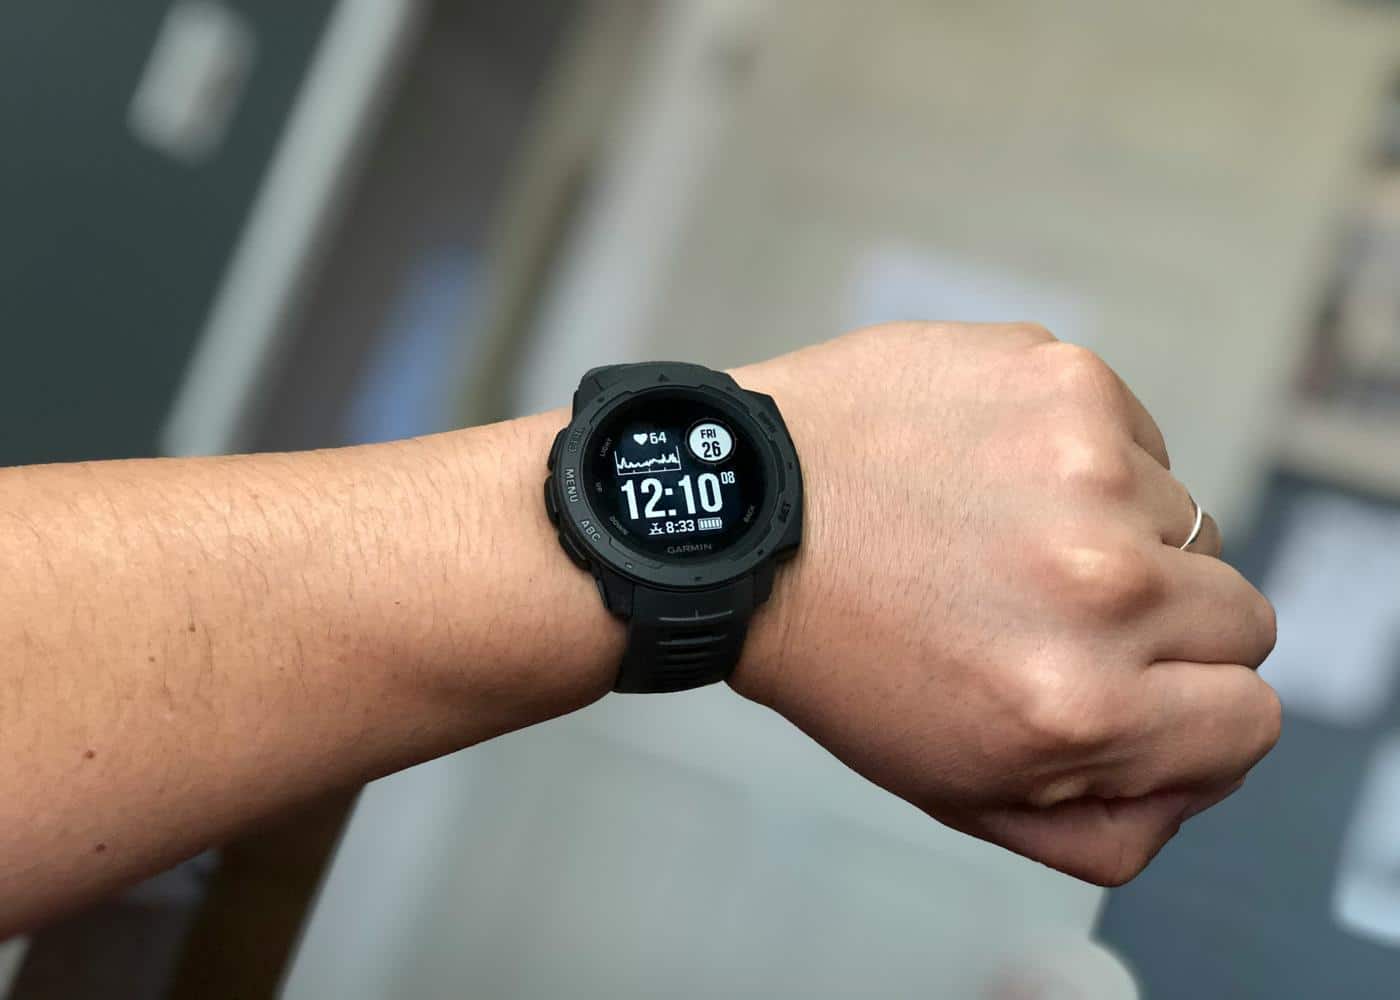
Heart Rate
Your heart rate shows how many times your heart beats per minute. Garmin tracks this throughout the day and during workouts to help you understand effort, intensity, and general cardiovascular response.
What a good score looks like: A good heart rate depends on context. During rest, lower is often associated with better cardiovascular fitness, while during workouts your heart rate should rise in line with effort.
Why you should care: Heart rate helps you understand how hard your body is working, whether you are training in the right zone, and how quickly you recover after exercise.
Resting Heart Rate
Resting heart rate is your heart rate when your body is at rest. Garmin uses this as one of the key signals for fitness, stress, and recovery.
What a good score looks like: A lower, stable resting heart rate is generally a positive sign, especially if it stays consistent over time. A sudden increase may suggest stress, illness, poor sleep, dehydration, or under-recovery.
Why you should care: Resting heart rate is one of the simplest ways to spot changes in your baseline health and recovery.
HRV Status
HRV status tracks heart rate variability, which measures the variation in time between heartbeats. Garmin compares your HRV against your personal baseline, rather than judging it against a universal “good” number. A balanced HRV status means your 7-day average is within your normal range.
What a good score looks like: A “balanced” HRV status is usually the goal. Low or unbalanced HRV may suggest your body is under more stress than usual.
Why you should care: HRV can help you understand how well your body is handling training, stress, sleep, and recovery.
Body Battery
Body Battery is Garmin’s energy score. It estimates your energy reserves throughout the day using data such as HRV, stress, sleep, and activity.
What a good score looks like: A high Body Battery score in the morning usually suggests you recovered well overnight. A low score late in the day is normal, but consistently waking up low may point to poor sleep or high stress.
Why you should care: Body Battery helps you decide whether to push harder, take an easier day, or focus on rest.
Stress Tracking
Garmin’s stress score estimates physiological stress using heart rate variability. Garmin defines 0 to 25 as resting, 26 to 50 as low stress, 51 to 75 as medium stress, and 76 to 100 as high stress.
What a good score looks like: Lower stress scores are generally better, especially during rest periods. Short spikes are normal, but long periods of high stress may suggest your body is struggling to recover.
Why you should care: Stress tracking can help you see how work, sleep, caffeine, alcohol, training, and daily habits affect your body.
Sleep Duration
Sleep duration measures how long you sleep each night. Garmin uses sleep data to support other metrics, including Body Battery, recovery, HRV status, and training readiness.
What a good score looks like: Most adults should aim for a consistent sleep routine and enough total sleep to feel rested. The exact number varies, but frequent short nights will usually show up elsewhere in your Garmin data.
Why you should care: Sleep is one of the biggest drivers of recovery, energy, mood, and training performance.
Sleep Stages
Garmin estimates how much time you spend in light, deep, and REM sleep. These stages give more detail than sleep duration alone.
What a good score looks like: A good night usually includes a mix of all stages, with enough deep sleep and REM sleep to support physical and mental recovery.
Why you should care: Sleep stages can help explain why two nights of the same length may leave you feeling completely different.
Sleep Score
Sleep score summarises your sleep quality into a single number. Garmin uses factors such as duration, stress, restlessness, and sleep stages to estimate how restorative your sleep was.
What a good score looks like: A higher sleep score usually suggests better recovery. Garmin user data has shown that better sleep tends to closely correlate with higher Body Battery scores.
Why you should care: Sleep score gives you a quick way to judge whether your body had enough quality rest before the day starts.
Respiration Rate
Respiration rate shows how many breaths you take per minute. Garmin can track this during the day, during sleep, and in some activities.
What a good score looks like: A stable respiration rate is usually a good sign. Sudden changes may be linked to illness, stress, altitude, or poor recovery.
Why you should care: Respiration can add useful context to sleep, stress, and overall wellbeing trends.
Pulse Ox
Pulse Ox estimates blood oxygen saturation. This can be useful during sleep, at altitude, or when monitoring general wellness trends.
What a good score looks like: Higher and stable oxygen saturation is generally preferred, although readings can vary depending on fit, movement, skin temperature, and device placement.
Why you should care: Pulse Ox can help provide extra context around breathing, altitude adaptation, and sleep quality, but it should not be treated as a medical diagnosis.
Skin Temperature
On compatible devices, Garmin can track skin temperature changes, often during sleep. This is more useful as a trend than as a single reading.
What a good score looks like: A stable baseline is usually expected. Noticeable deviations may reflect changes in sleep environment, illness, menstrual cycle, alcohol, stress, or recovery status.
Why you should care: Skin temperature can help you spot changes in your body before they are obvious from other metrics.
Recovery Time
Recovery time estimates how long your body may need before it is ready for another hard session. It is influenced by workout intensity, fitness level, stress, sleep, and other recovery signals.
What a good score looks like: A shorter recovery time after moderate training usually suggests your body is adapting well. A long recovery time after hard training is normal.
Why you should care: Recovery time helps you avoid stacking too many intense workouts too close together.
Training Readiness
Training readiness gives you a daily score that helps estimate how prepared you are for hard training. Garmin uses factors such as sleep, recovery, HRV, acute load, and stress to inform this score.
What a good score looks like: A higher score suggests you may be ready for a more demanding session. A lower score suggests you may benefit from rest, mobility, easy cardio, or reduced intensity.
Why you should care: Training readiness helps turn your recovery data into a more practical daily training decision.
Training Status
Training status shows how your body is responding to your recent training. It may describe your progress as productive, maintaining, recovery, strained, overreaching, or detraining, depending on your data.
What a good score looks like: “Productive” usually means your training is improving fitness while staying manageable. “Maintaining” can also be fine if you are not actively trying to build fitness.
Why you should care: Training status helps you understand whether your current routine is moving you forward, keeping you steady, or pushing you too hard.
Training Load
Training load estimates how much stress your recent workouts place on your body. Garmin uses this to help assess whether your training volume is low, optimal, or too high.
What a good score looks like: A good training load sits within your optimal range for your current fitness and goals.
Why you should care: Training load helps you balance consistency with recovery, reducing the risk of doing too much too soon.
VO2 Max
VO2 max estimates your aerobic fitness, or how efficiently your body can use oxygen during intense exercise.
What a good score looks like: A good VO2 max depends on your age, sex, and fitness level. The most important sign is steady improvement over time.
Why you should care: VO2 max is one of Garmin’s most useful long-term indicators of cardiovascular fitness and endurance progress.
Fitness Age
Fitness age estimates how your fitness compares to typical values for your age group. It is usually influenced by VO2 max, activity level, body composition, and resting heart rate.
What a good score looks like: A lower fitness age than your actual age is generally considered positive.
Why you should care: Fitness age gives you a simple, motivating snapshot of your overall fitness trajectory.
Calories Burned
Garmin estimates calories burned through resting metabolism, daily movement, and exercise.
What a good score looks like: There is no universal “good” calorie burn. It depends on your body size, activity level, goals, and training plan.
Why you should care: Calories burned can help with energy balance, nutrition planning, and understanding how active your day really was.
Hydration Tracking
Hydration tracking lets you log fluid intake and compare it with your activity, sweat loss, and daily habits.
What a good score looks like: A good score means you are consistently meeting your hydration goal, especially around workouts or hot weather.
Why you should care: Hydration affects energy, performance, recovery, digestion, and heart rate response during exercise.
Menstrual Cycle and Pregnancy Tracking
Garmin offers menstrual cycle and pregnancy tracking features to help users log symptoms, cycle phases, and related health patterns.
What a good score looks like: This is less about a “good” score and more about consistent tracking. The value comes from spotting patterns across symptoms, energy, sleep, training, and recovery.
Why you should care: Cycle and pregnancy tracking can add important context to changes in performance, mood, sleep, cravings, and recovery.
ECG App
On select Garmin devices and in supported regions, the ECG app can record an electrocardiogram and check for signs of atrial fibrillation.
What a good score looks like: A normal sinus rhythm result is generally the expected outcome, but ECG readings should always be interpreted carefully and followed up with a medical professional if needed.
Why you should care: ECG can provide useful heart rhythm information, but it is not a replacement for professional medical advice or diagnosis.
Interpreting Your Garmin Data With Neura
Garmin gives you a detailed view of what is happening in your body, but the real challenge is understanding why those numbers are changing.
A low Body Battery score, poor HRV status, high stress reading, or longer recovery time can all be useful signals, but they are much more powerful when interpreted alongside the rest of your health data.
That is where Neura can help. By connecting your Garmin data with other health inputs, including sleep, nutrition, stress, supplements, medications, habits, and personal goals, Neura helps you see the bigger picture behind your daily metrics.
For example, instead of simply showing that your HRV dropped, Neura can help you explore possible contributing factors, such as a harder training week, reduced sleep quality, higher caffeine intake, poor hydration, or increased work stress.
Instead of treating each Garmin stat as a separate number, Neura helps connect the dots between your routines and your results.
You can also use Neura to build personalized health plans based on what your Garmin data is telling you. Whether you want to improve recovery, increase energy, sleep better, train more consistently, or manage stress, Neura automatically transforms your metrics into clear daily actions.
Garmin is excellent for tracking your body. Neura helps you understand what your data means and what to do next.
How to Integrate Garmin with Neura
Connecting your Garmin device to Neura is a straightforward process that allows for a seamless flow of information between the hardware and the analytical software. Follow these steps to get started:
Download the Neura App: Ensure you have the latest version of the Neura application installed on your smartphone.
Access Settings: Open the app and navigate to the "Connected Devices" or "Integrations" section within your profile settings.
Select Garmin: Find Garmin in the list of supported wearable brands and tap "Connect."
Sync Your Data: Once authorized, return to the Neura app. It may take a few minutes for the initial sync to pull your historical Garmin health metrics into the dashboard.
Verify the Connection: Check your Neura dashboard to see your most recent data synced.
Once the integration is complete, your data will sync automatically in the background.

Final Thoughts: Understanding Your Garmin Health Metrics
Owning a Garmin is a powerful first step toward taking control of your well-being, but the real power lies in interpretation.
By understanding the nuances of HRV, VO2 Max, and Body Battery, you move away from guesswork and toward a lifestyle informed by science.
The integration of tools like Neura further enhances this experience, transforming a list of stats into a comprehensive roadmap for health.
Remember that no single metric is a silver bullet. Your health is a complex web of interconnected systems, and the goal is to look for trends over time rather than obsessing over a single day's score.
Use your data as a compass, not a judge, and you will find that achieving your fitness goals becomes a much more manageable and rewarding process.
Article FAQ
Does Garmin data sync to Apple Health?
Yes. In the Garmin Connect app, go to Settings > Connected Apps > Apple Health to enable syncing. This allows Garmin to push data like steps, heart rate, and sleep directly to the Apple Health dashboard.
what kind of fitness metrics can i track on a Garmin watch?
Garmin tracks a wide range of garmin health metrics including heart rate, HRV, Pulse Ox, sleep stages, and VO2 Max. It also monitors activity-specific data like intensity minutes, body battery, and stress levels.
Can Garmin detect heart problems?
Selected models with the ECG app can screen for Atrial Fibrillation (AFib). While Garmin provides high/low heart rate alerts, it is a wellness tool, not a diagnostic medical device.
Why is my Body Battery always low?
A low score usually stems from poor sleep quality, high physiological stress, or alcohol consumption. It indicates your body isn't recovering enough to "recharge" your internal battery overnight.
How accurate is Garmin sleep tracking?
Garmin is highly accurate for tracking sleep duration and consistency. While stage timing (REM vs. Deep) is an estimate, the overall trends are excellent for monitoring long-term recovery patterns.
What is a "good" HRV status?
There is no "perfect" number. A "good" status is Balanced, meaning your current 7-day average aligns with your personal 3-week baseline, signaling your body is handling stress well.